
Milk Stork · B2B SaaS · Benefits reportingTurning raw data into decisions HR can act on.
Employer clients needed clear visibility into how their benefit was being used. I designed a reporting dashboard that brings shipment, enrollment and spend data together in one place, so HR teams can see how the benefit is used and what it’s worth.
My roleLead product designer: research, design and testing
TeamHead of Product, 3 engineers, Customer Success Manager, Head of Growth
UsersHR and benefits admins at employer clients
Timeline2024-2025
30+
employers using the dashboard
35%
fewer manual reporting requests to support
20%
increase in program use
1,000+
shipments tracked each month
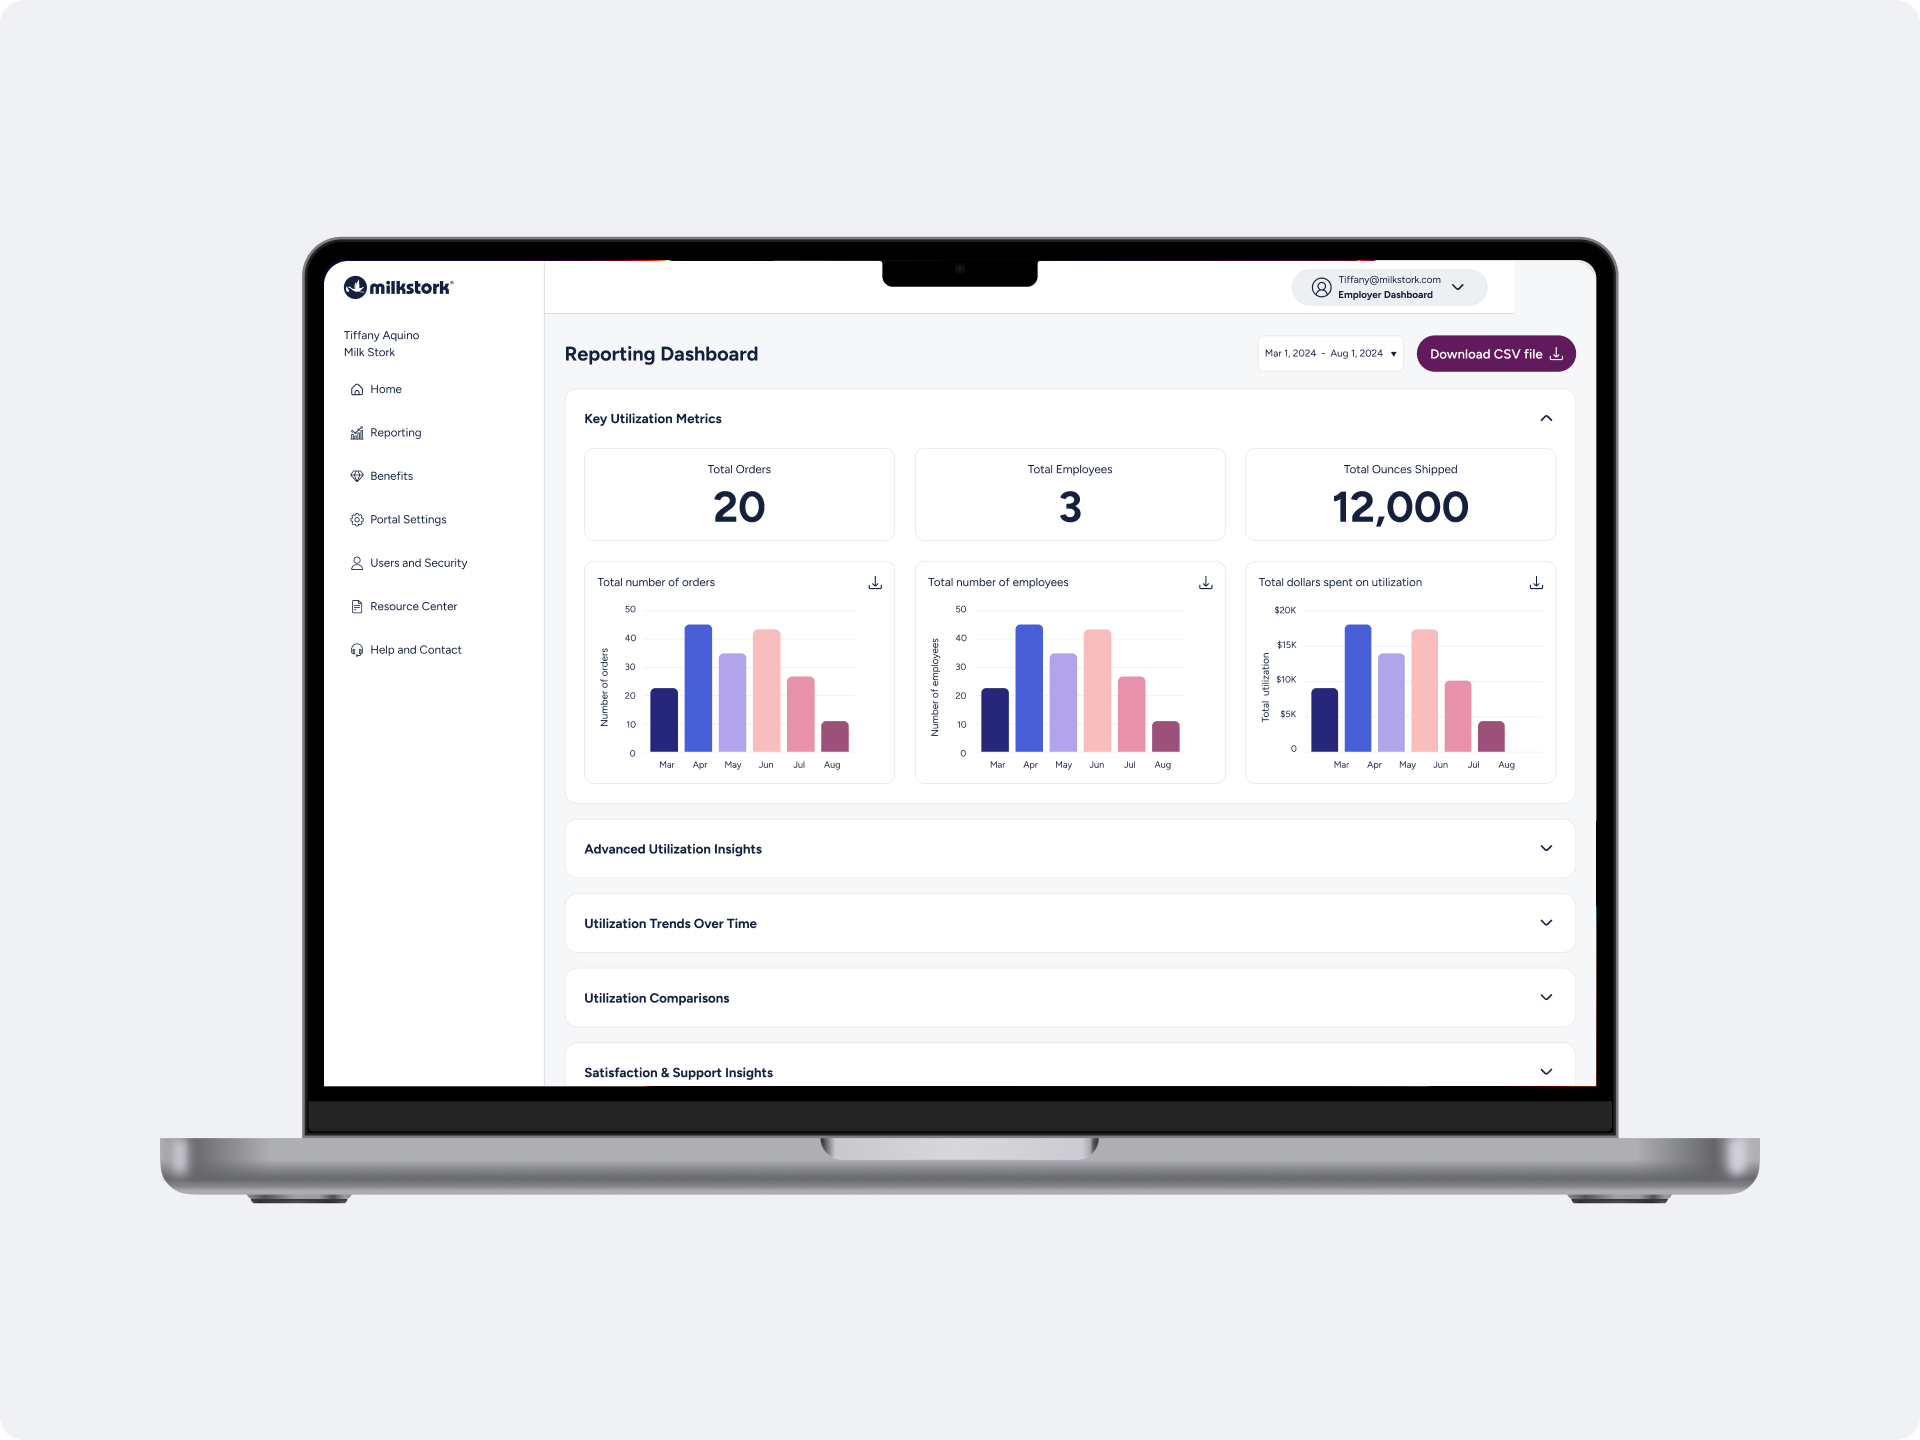
01 — ProblemHR teams needed a reliable way to measure the value of their benefit.
Shipment, enrollment and spend data lived in separate systems and was shared as raw CSV exports. Answering a client’s question often required a support request, and HR leaders lacked a clear summary to share with leadership at renewal.
“Is the benefit actually improving retention? I have no idea.”
HR director
“I need to justify this cost to my CFO. What data can you give me?”
Benefits manager
“How many of our employees are actually using this?”
HR manager
02 — ApproachOne dashboard, built around the four questions HR actually asks.
Instead of showing every data point, I organized the dashboard around the questions HR teams asked most often in support requests and interviews.
Key numbers: How many employees, orders and dollars?
Who uses it: Which employees and which benefits?
Trends & comparisons: Is it growing, and how do we compare?
Satisfaction & support: Are employees happy with it?
03 — Key decisionsEvery decision aimed to make the data easy for HR teams to understand.
Decision 1Show the most important numbers first
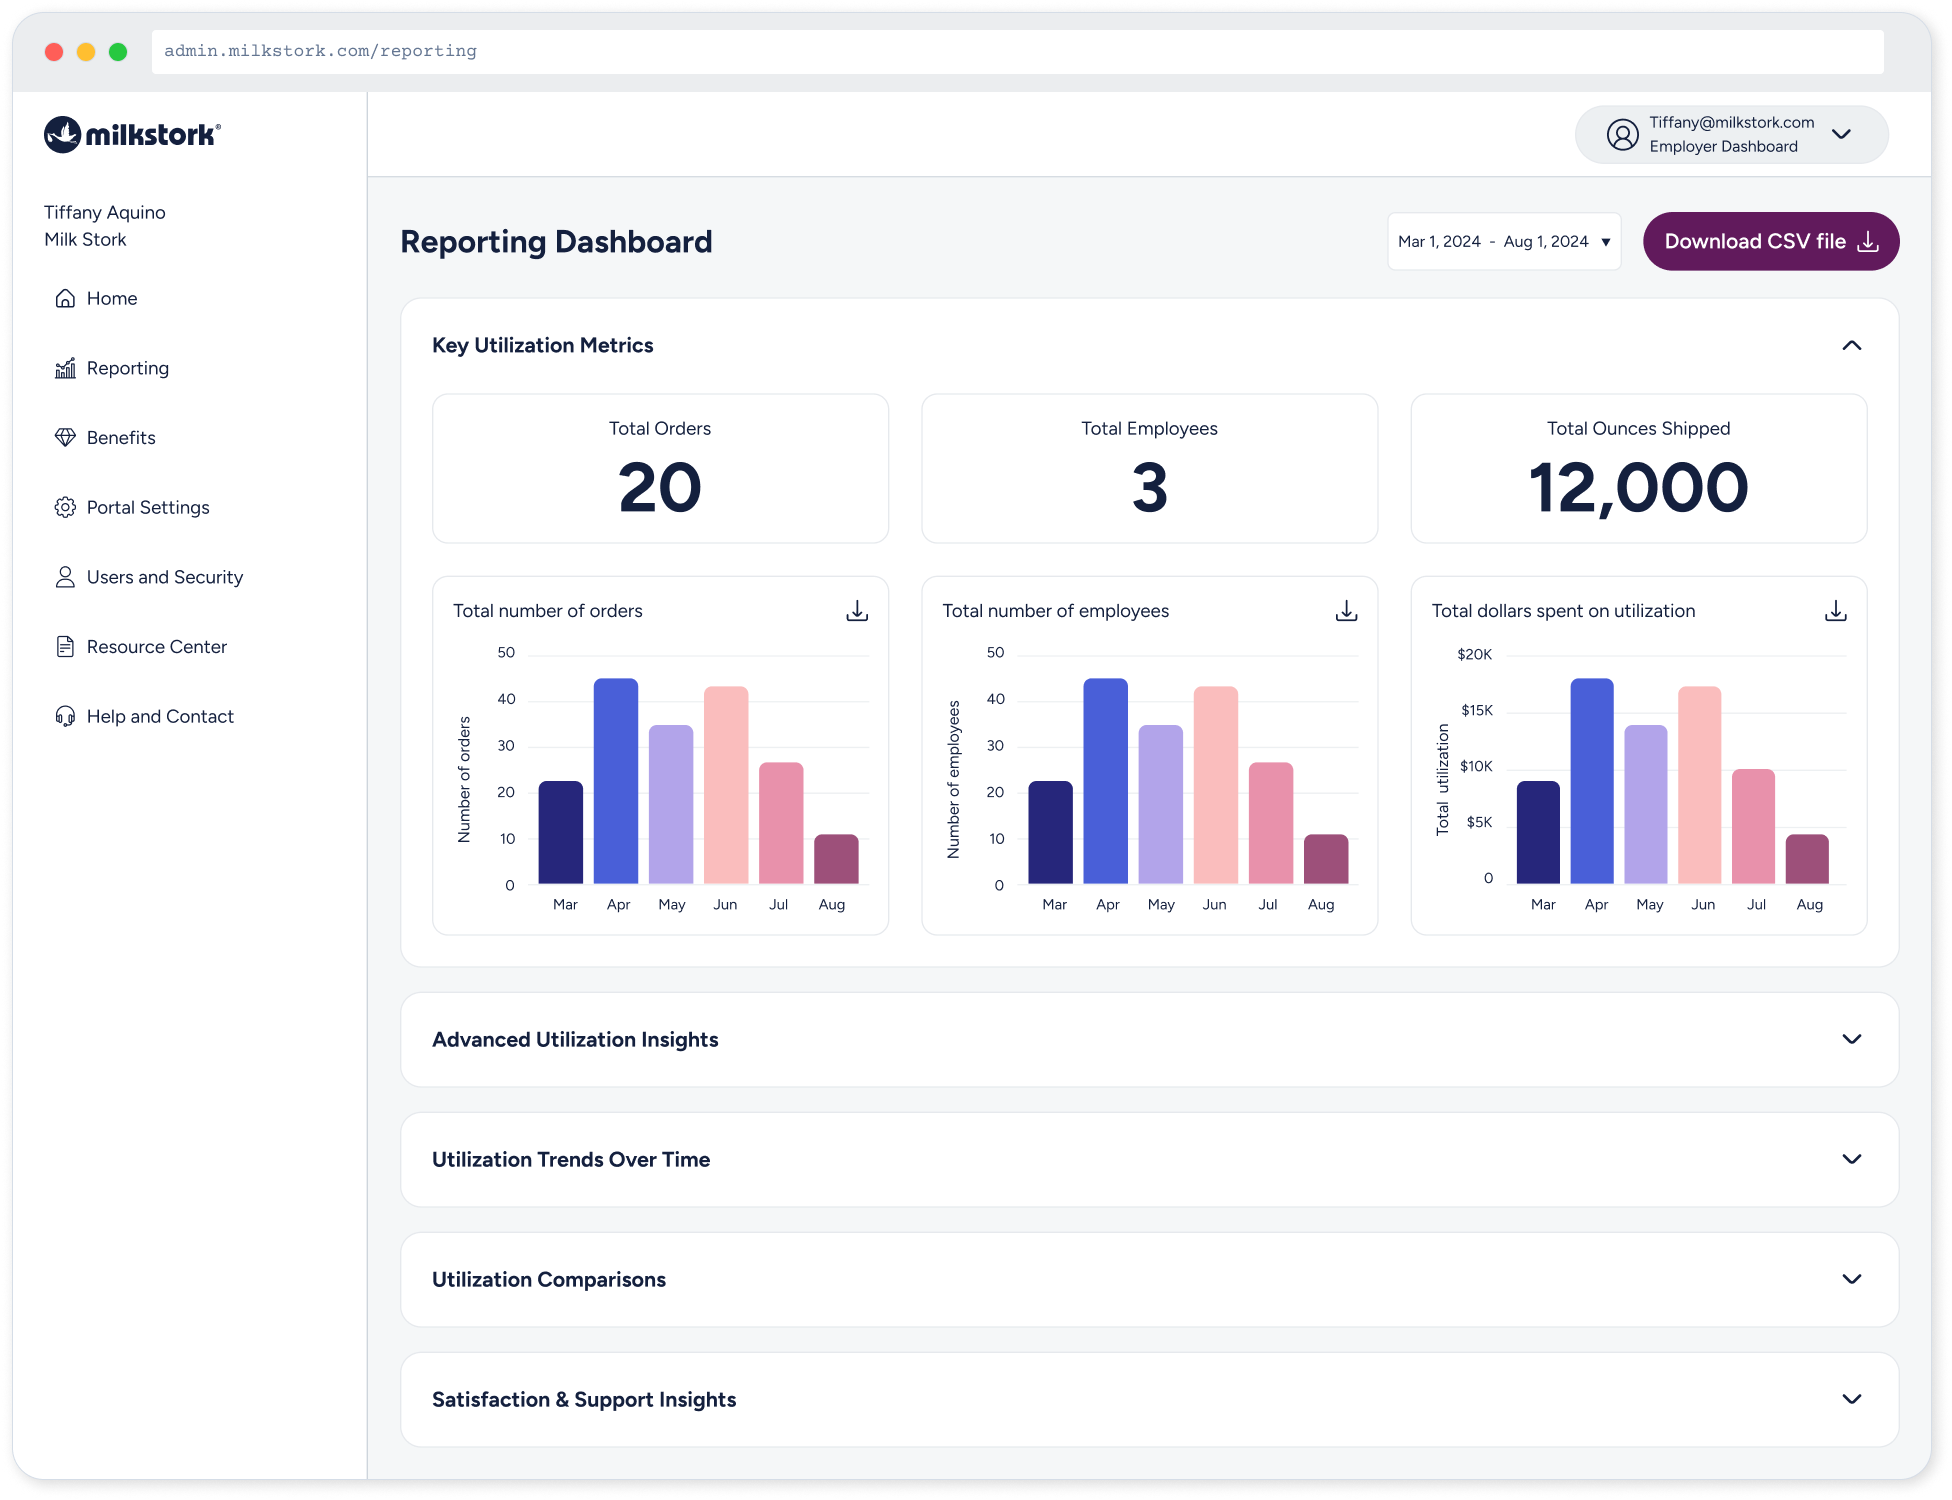
Most HR managers only need a few key numbers. Those stay visible at the top, and more detailed sections open when needed, so common questions are answered at a glance.
Decision 2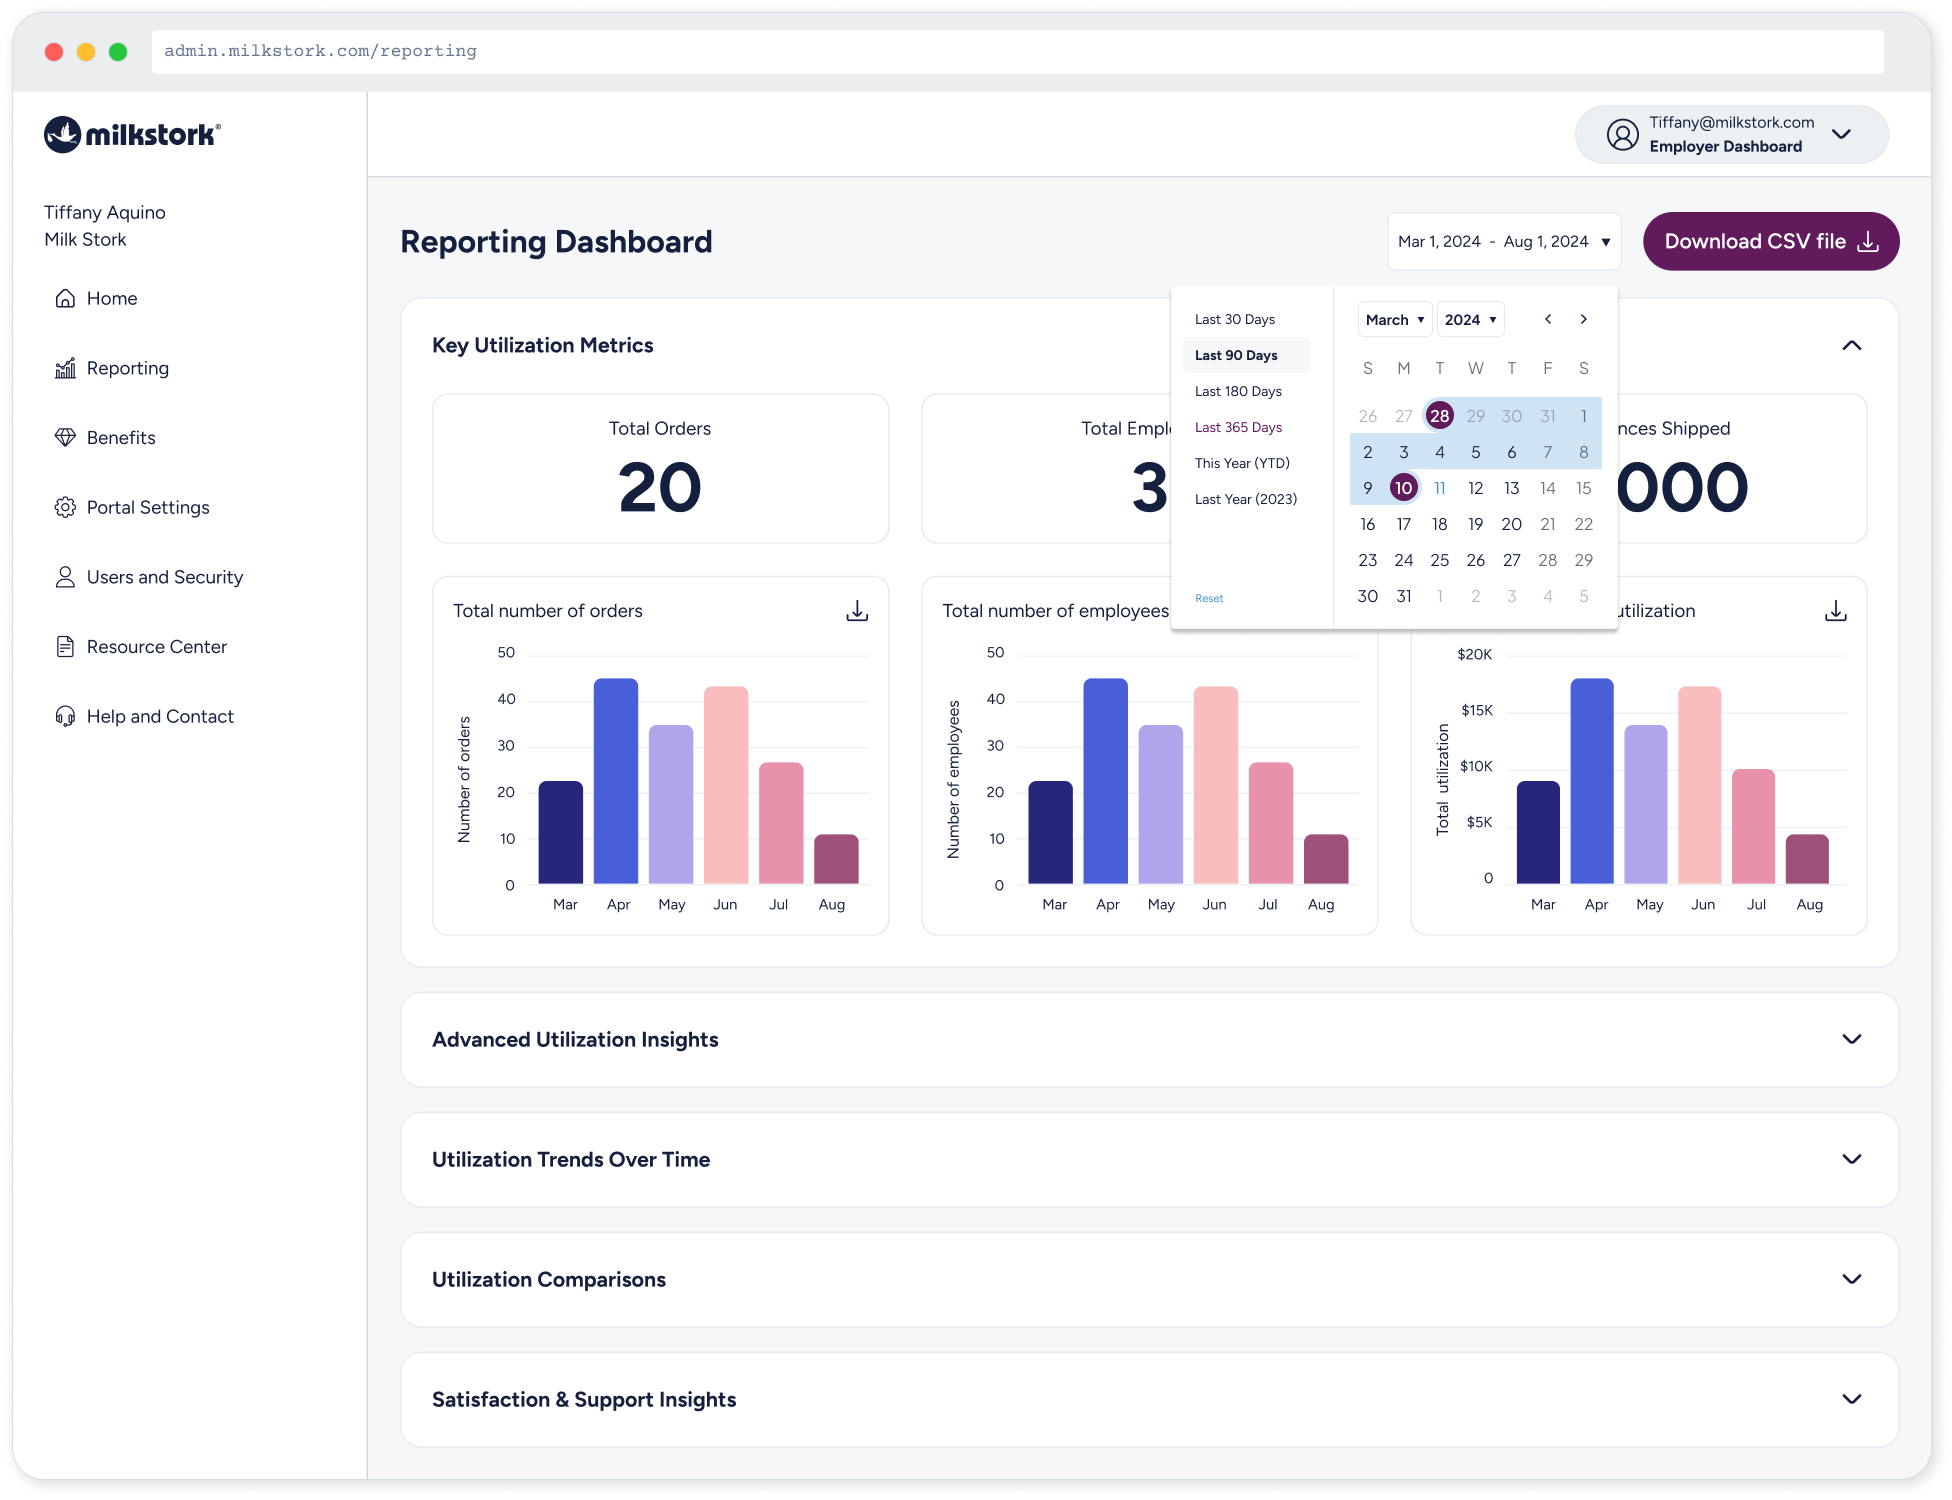
HR leaders often share numbers in their own presentations. The download button sits next to the date range at the top, so getting the data takes one click.
Easy data download
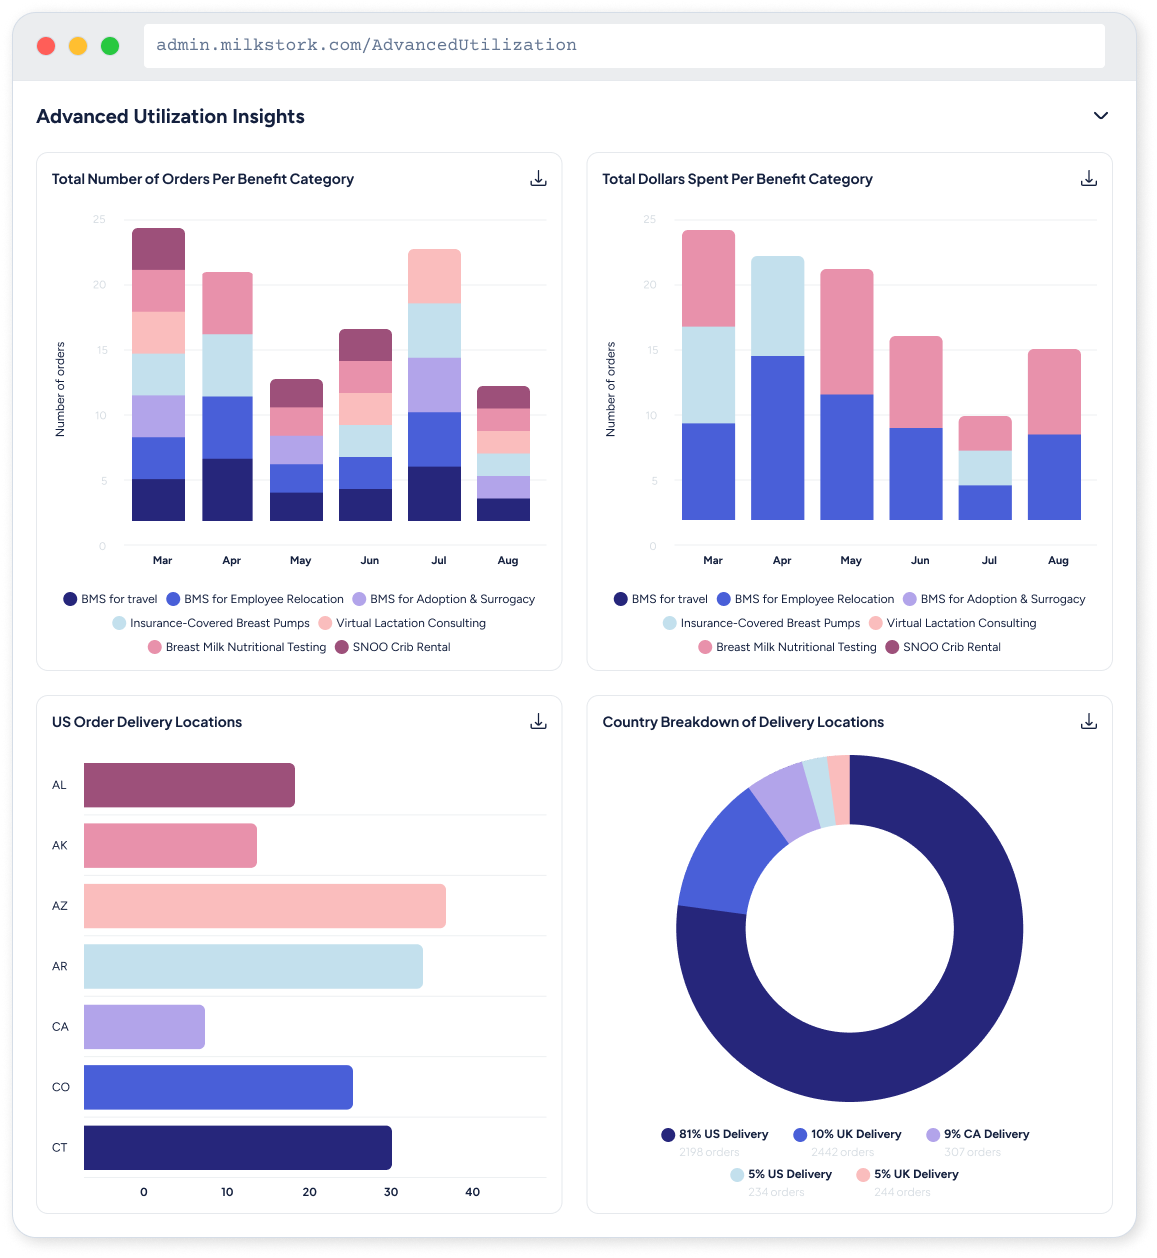
Decision 3Bar charts for monthly totals, line charts for trends over time, and the same colors throughout so each category is easy to recognize.
The right chart for each question
Decision 4New accounts start without data. Each section explains what will appear and when, so the experience feels complete from the first login.
Helpful screens for new accounts
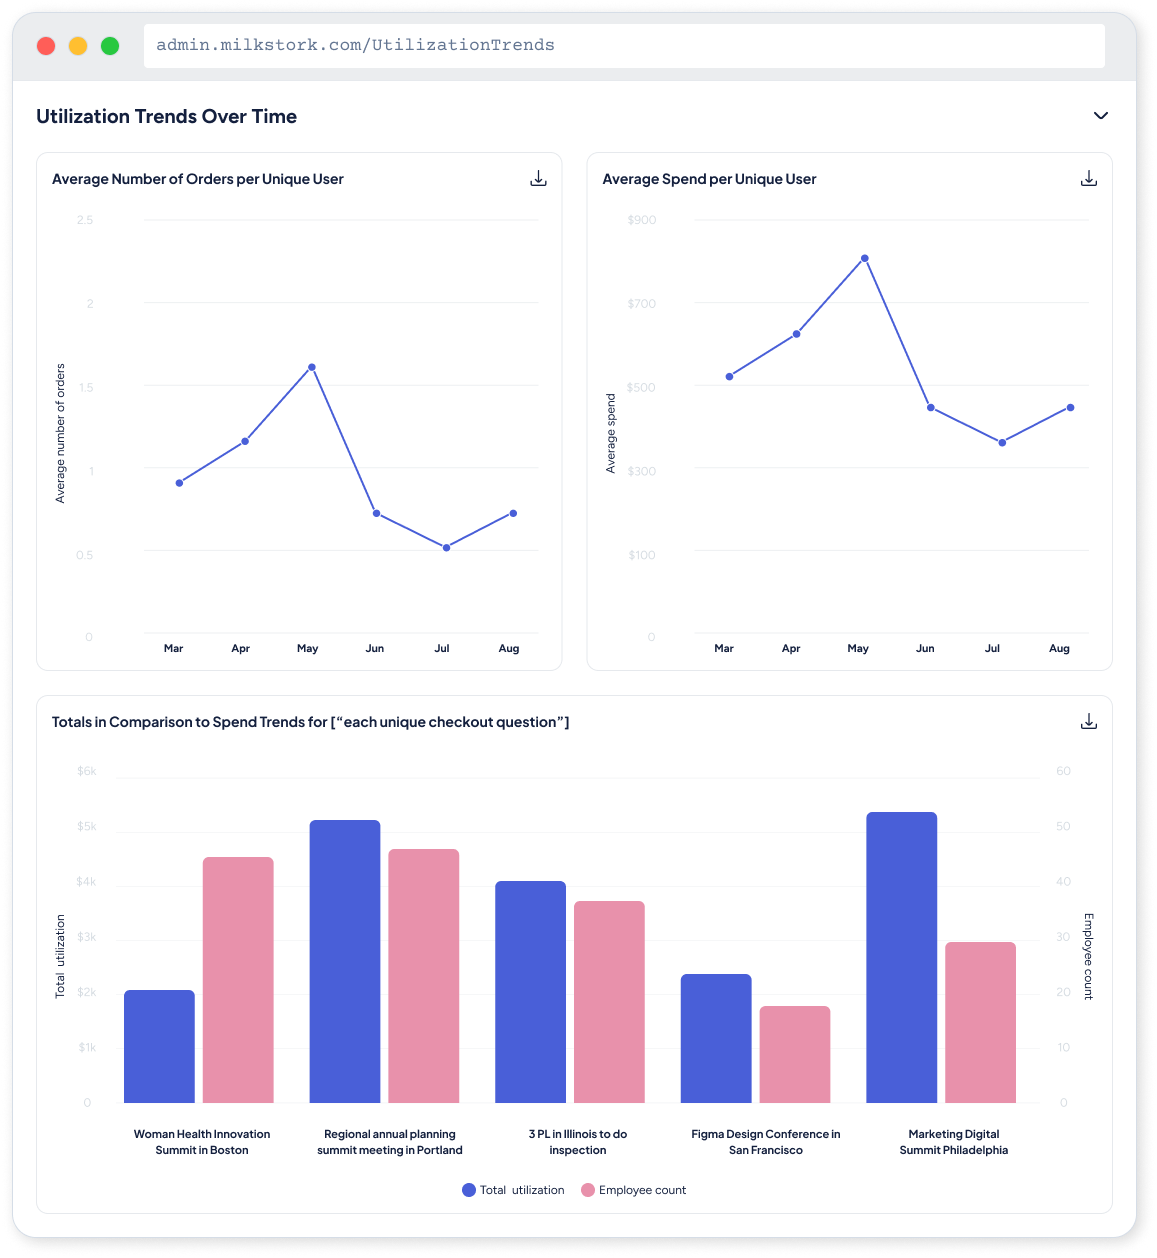
04 — ImpactThe dashboard shipped to 30+ employer organizations. Manual reporting requests to support dropped 35%, and program use grew 20% among clients using the dashboard.
Clearer answers for clients and fewer support requests.
WHAT I LEARNEDThe best data visualization isn’t the most impressive one, it’s the one that makes the right decision obvious.
DEEP DIVEFull process documentation
Process documentation
Research, early design ideas, special cases and developer specs are documented in Figma and available for review on request.
Research · Early ideas · Special cases · Developer specs