
Milk Stork · B2B SaaS · Benefits reportingTurning raw data into decisions HR can act on.
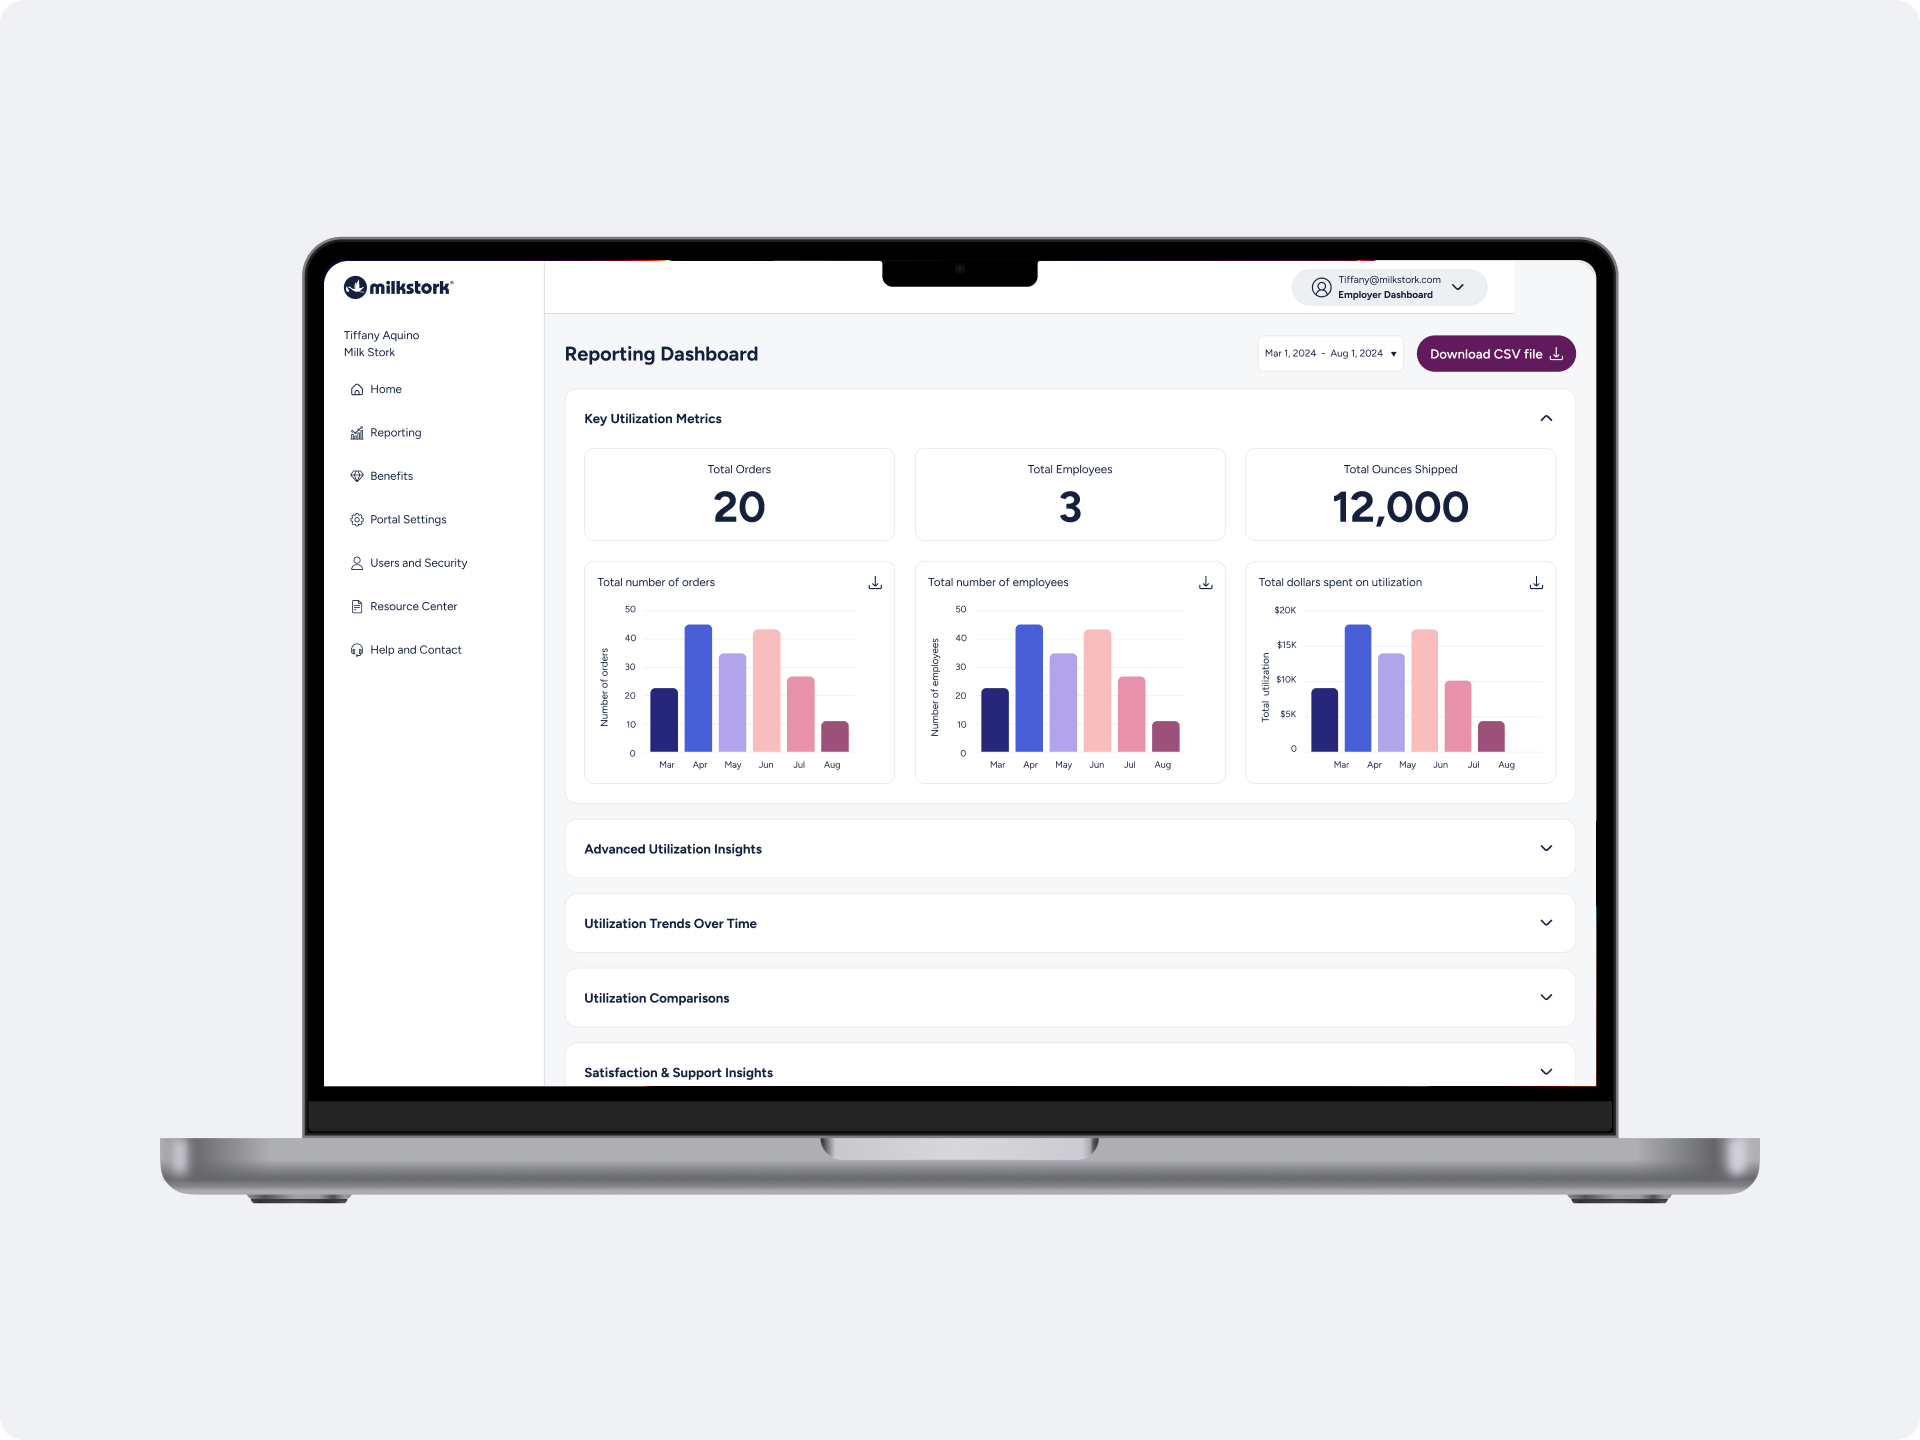
HR teams were paying for a benefit they couldn’t measure. I designed a self-serve reporting dashboard that turned fragmented shipment data into clear answers about who uses the program and whether it’s working.
My roleSole product designer: research, UX, UI, data viz, QA
TeamHead of Product, 3 engineers, CSM, Head of Growth
Timeline2024-2025
UsersHR and benefits admins at employer clients
30+
employer organizations using the dashboard
35%
fewer manual reporting requests to support
20%
increase in program utilization through visibility
1,000+
shipments a month made visible to HR
01 — Problem02 — ApproachHR teams were spending on a benefit they couldn’t prove was working.
The data existed: shipments, enrollment, spend, but it was scattered across systems and exported as raw CSVs nobody could read. Every question became a support ticket, and HR leaders had nothing to show their CFO at renewal.
“Is the benefit actually improving retention? I have no idea.”
HR director
“I need to justify this cost to my CFO. What data can you give me?”
Benefits manager
Decision 3“How many of our employees are actually using this?”
HR manager
One dashboard, built around the four questions HR actually asks.
Instead of surfacing every data point, I organized the dashboard around the questions from support tickets and interviews, ordered from “what’s happening?” to “why does it matter?”
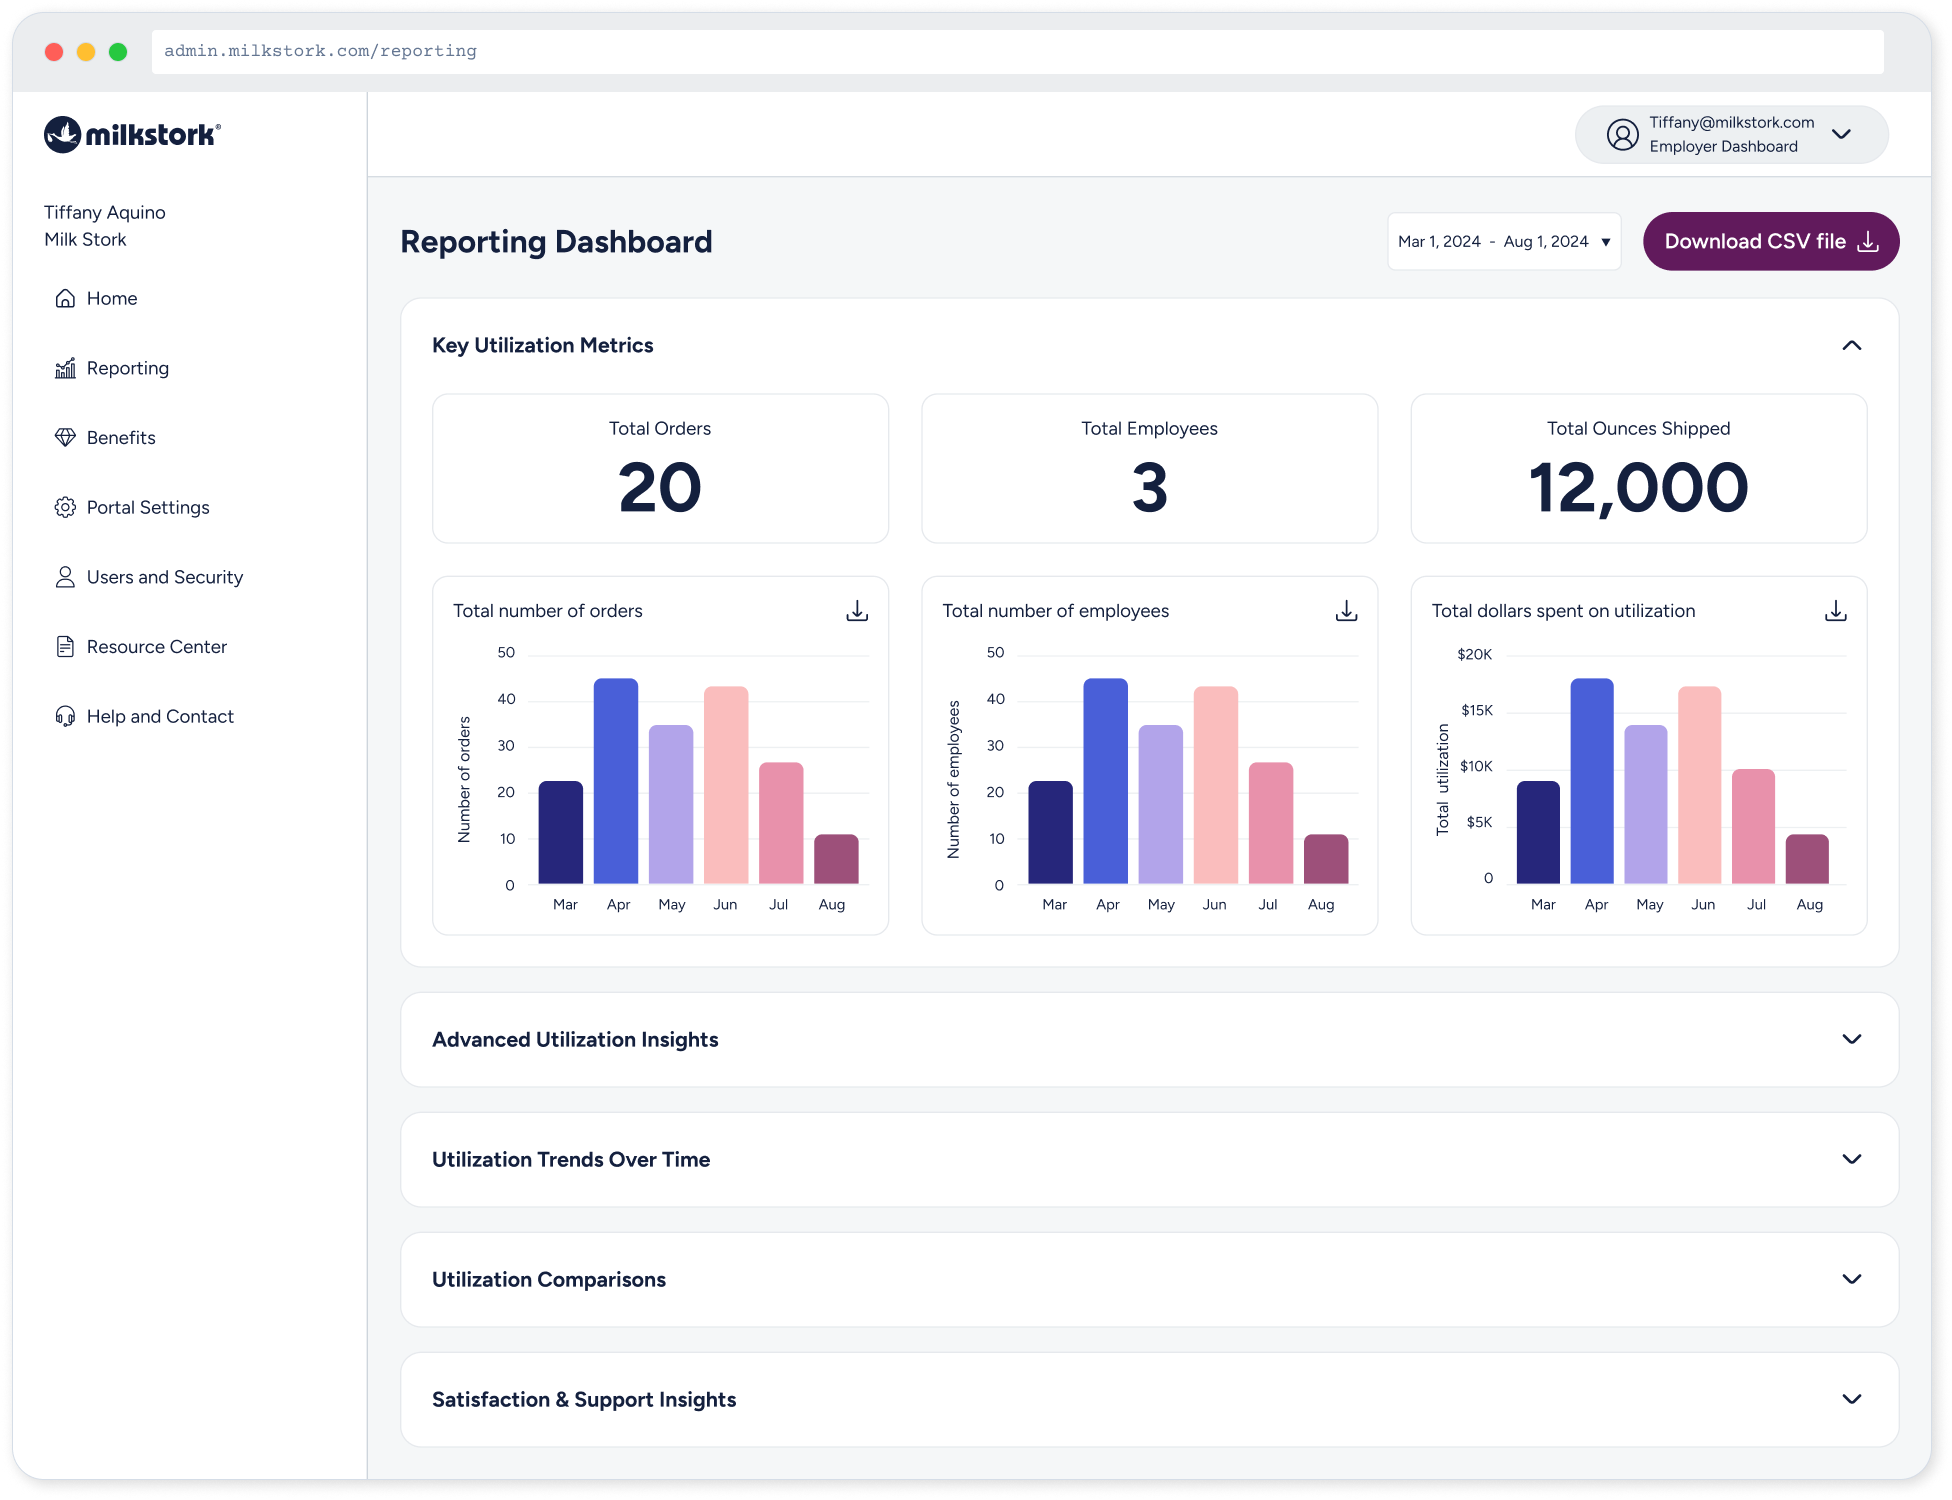
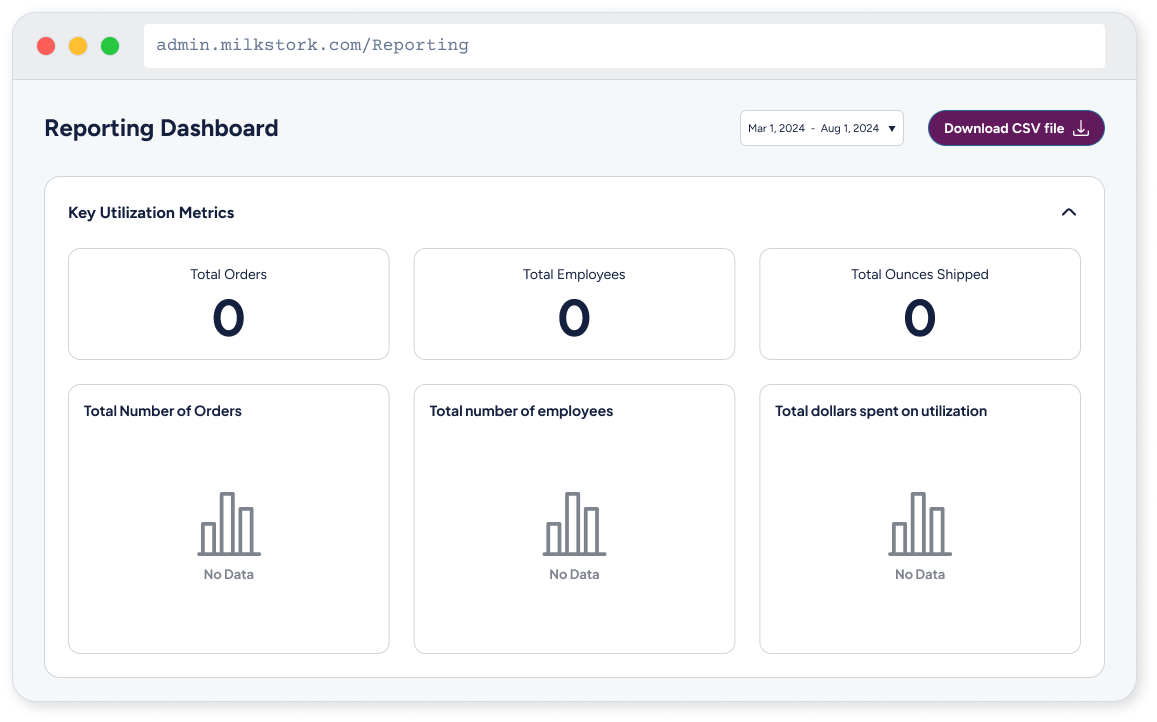
Key utilization metrics
How many employees, orders and dollars?
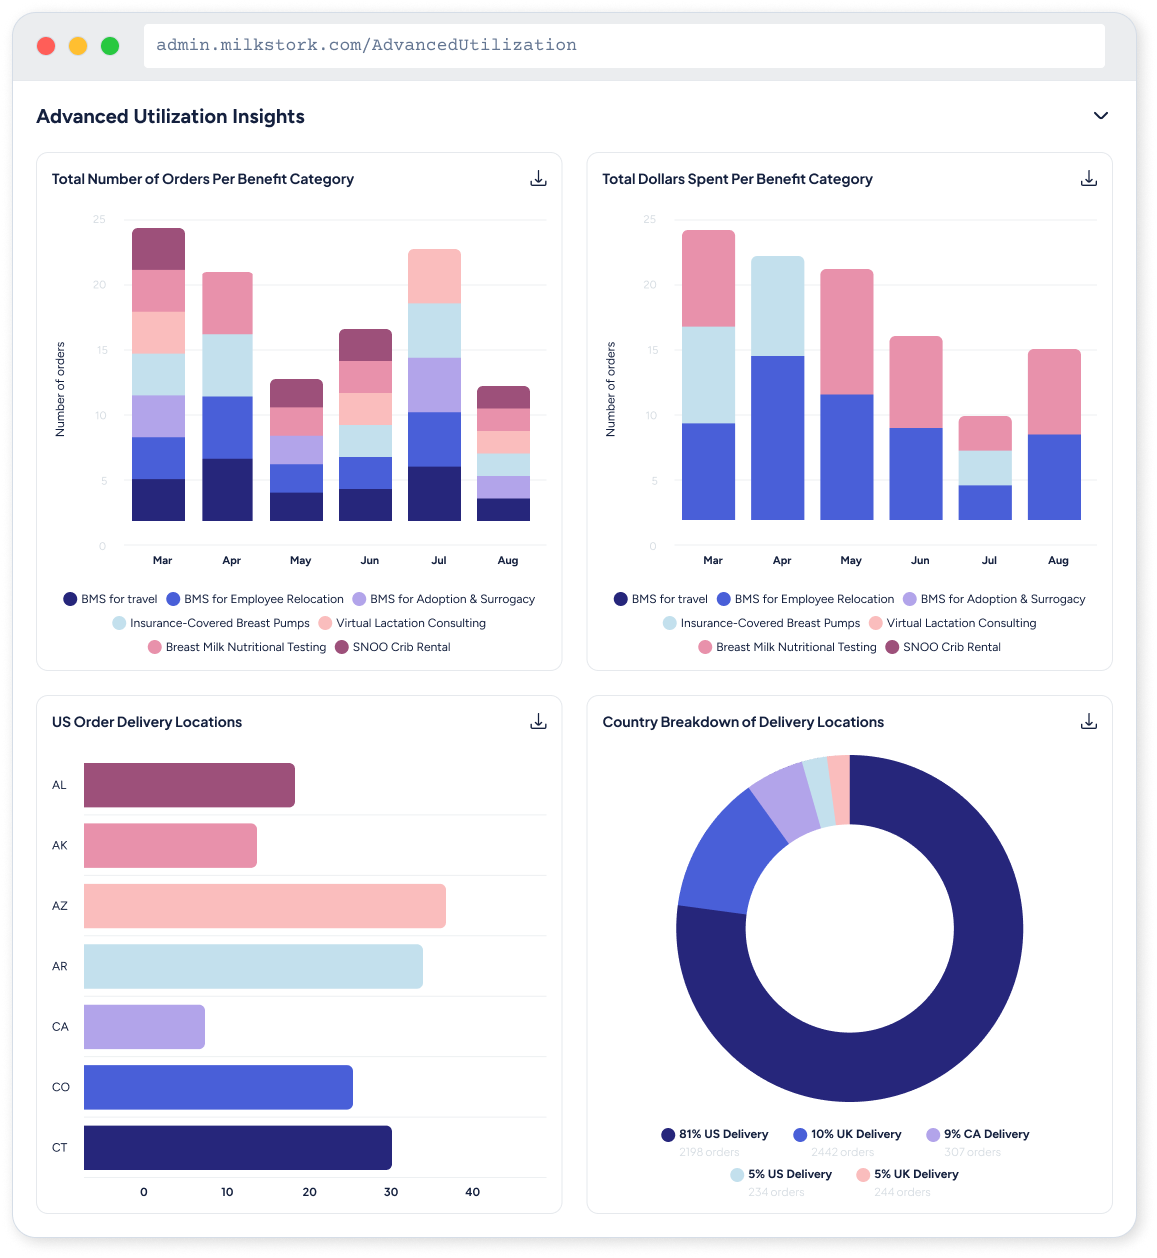
Advanced insights
Who uses it, by segment and benefit type?
Trends & comparisons
Is it growing, and how do we compare?
New clients start with zero data. Instead of blank charts, each section says what will appear and when, so a new account still feels set up and working.
04 — ImpactSatisfaction & support
Are employees happy with it?
03 — Key decisionsDecision 2Decision 4Every choice was about reducing cognitive load for people who aren’t data analysts.
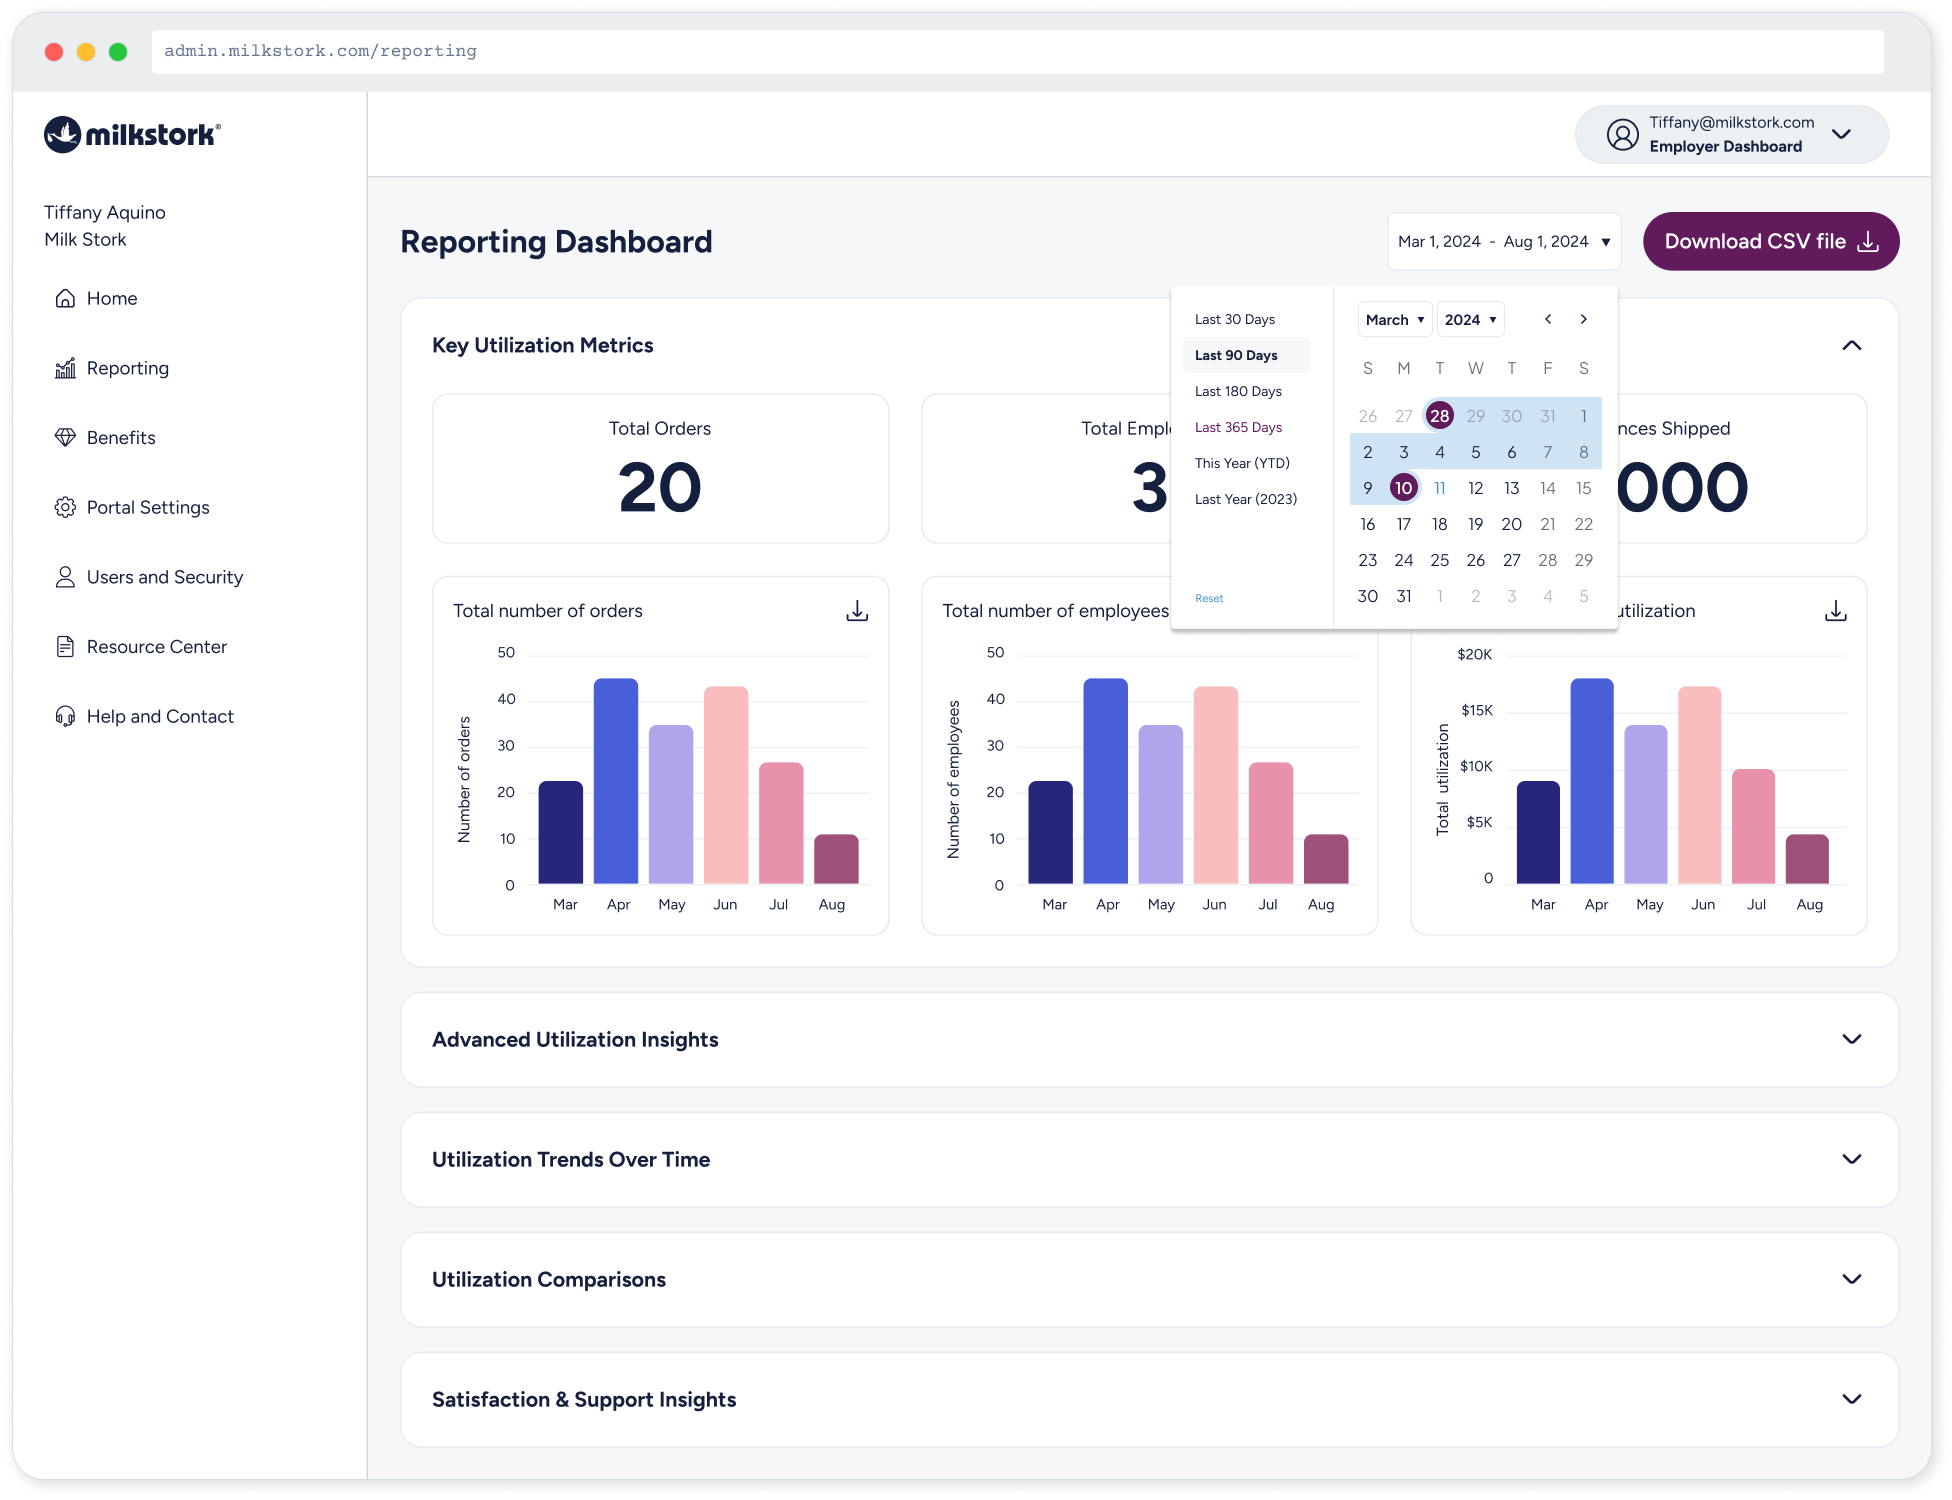
CSV export always one click away
HR leaders still take numbers into their own decks. The export sits pinned in the header with the date range, so the dashboard supports their workflow instead of replacing it.
WHAT I LEARNEDEmpty states that explain, not just apologize
Decision 1Progressive disclosure with collapsible sections
Most HR managers only need the top-line numbers. Key metrics stay open; deeper insights collapse below, so the default view answers the most common questions without scrolling.
The right chart for each question
Bars for monthly counts, lines for trends, a donut only where parts-of-a-whole really matter. One consistent palette keeps categories recognizable from chart to chart.
HR teams stopped asking. They started knowing.
The dashboard shipped to 30+ employer organizations. Manual reporting requests to support dropped 35%, and clients who could see their numbers drove a 20% lift in program utilization. [Add how each number was measured and over what period.]
The best data visualization isn’t the most impressive one — it’s the one that makes the right decision obvious.